Goal
Juxtaposing the ebb and flow of the US stock market, represented by the Dow Jones Industrial Average, with the unfolding crisis of the COVID-19 pandemic, this analysis provides a unique perspective. By converting cumulative COVID-19 case data into a daily case count metric, we aim to unveil the synchronicities or disparities between economic performance and the public health landscape during these unprecedented times.
Import the Data
Run the following code to download two time series data sets:
- Historical data on the Dow Jones Industrial Average (a composite performance measure of the US stock market), retrieved from Yahoo Finance.
- Cumulative COVID19 cases over time, from the New York Times.
import pandas as pd
import datetime

url = "https://query1.finance.yahoo.com/v7/finance/download/%5EDJI?period1=1580750232&period2=1612372632&interval=1d&events=history&includeAdjustedClose=true"
DJI = pd.read_csv(url)
DJI['date'] = pd.to_datetime(DJI['Date'])
DJI = DJI.drop(["Date"], axis = 1)
DJI.head()
| Open | High | Low | Close | Adj Close | Volume | date | |
|---|---|---|---|---|---|---|---|
| 0 | 28319.650391 | 28630.390625 | 28319.650391 | 28399.810547 | 28399.810547 | 307910000 | 2020-02-03 |
| 1 | 28696.740234 | 28904.880859 | 28696.740234 | 28807.630859 | 28807.630859 | 332750000 | 2020-02-04 |
| 2 | 29048.730469 | 29308.890625 | 29000.849609 | 29290.849609 | 29290.849609 | 357540000 | 2020-02-05 |
| 3 | 29388.580078 | 29408.050781 | 29246.929688 | 29379.769531 | 29379.769531 | 263700000 | 2020-02-06 |
| 4 | 29286.919922 | 29286.919922 | 29056.980469 | 29102.509766 | 29102.509766 | 252860000 | 2020-02-07 |
url = "https://raw.githubusercontent.com/nytimes/covid-19-data/master/us.csv"
COVID = pd.read_csv(url)
COVID['date'] = pd.to_datetime(COVID['date'])
COVID.head()
| date | cases | deaths | |
|---|---|---|---|
| 0 | 2020-01-21 | 1 | 0 |
| 1 | 2020-01-22 | 1 | 0 |
| 2 | 2020-01-23 | 1 | 0 |
| 3 | 2020-01-24 | 2 | 0 |
| 4 | 2020-01-25 | 3 | 0 |
Reshape the data
The series COVID['cases'] is essentially a numpy array containing the cumulative case counts over time. The COVID19 case data is cumulative, but we would like to see the number of new cases per day. Construct a new array, called per_day, giving the number of new cases per day. Then, make a new array called per_day_date that gives the appropriate date for each case count. In particular, per_day and per_day_date should have the same shape.
per_day = np.diff(COVID["cases"]) # use np.diff function to find out the the number of new cases per day
per_day_date = COVID["date"].loc[1:] # select all the dates except for the day with index 0
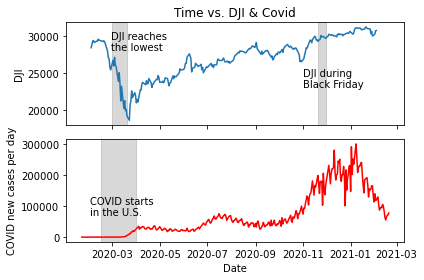
Plot the Dow Jones Industrial Average over time & Plot the variables per_day_date and per_day to visualize the progress of the COVID19 pandemic over time.
# your solution here
# modify this block in the remaining parts of the problem

# create 2 empty subplots on the same column and use sharex to make two subplots share the same horizontal axis
fig, ax = plt.subplots(2, 1, sharex = True)
ax[0].plot(DJI["date"], DJI["Close"]) # make the upper subplot have data of "date" and "Close" from DJI dataframe
ax[1].plot(per_day_date, per_day, color = "red") # make the lower subplot have data of per_day_date and per_day

ax[0].set(ylabel = "DJI") # add "DJI Close" as y-label on the upper subplot
ax[1].set(xlabel = "Date", ylabel = "COVID new cases per day") # add "Date" as x-label and "COVID new cases per day" as y-label of the lower subplot

# DJI starts to decrease
ax[0].axvspan(datetime.datetime(2020,3,1),
              datetime.datetime(2020,3,20),
              alpha = .3,
              color = "gray")
# DJI during Black Friday
ax[0].axvspan(datetime.datetime(2020,11,20),
              datetime.datetime(2020,11,30),
              alpha = .3,
              color = "gray")
# COVID starts in the U.S.
ax[1].axvspan(datetime.datetime(2020,2,15),
              datetime.datetime(2020,4,1),
              alpha = .3,
              color = "gray")

ax[0].text(datetime.datetime(2020,2,28),
           28000,
           "DJI reaches\nthe lowest")
ax[0].text(datetime.datetime(2020,11,1),
           23000,
           "DJI during\nBlack Friday")
ax[1].text(datetime.datetime(2020,2,1),
           70000,
           "COVID starts\nin the U.S.")

ax[0].set(title = "Time vs. DJI & Covid")
plt.tight_layout() # avoid squished plots